Over the last year, energy traders have learnt what stock traders have always been aware of: prices can be fluctuating on a larger scale than what we might expect. This has the potential to lead to issues when backtesting an algorithmic trading strategy.
A simple backtest
Let’s start at the beginning. When you start to design an algorithmic trading strategy you first want to be sure that your signal, your entry and exit logic, was able to show an edge. The historic results then would lead to your decision if you want to deploy the strategy and with what quantity you would want to trade it.
The result of your backtest allows you to make an informed decision of whether or not to deploy your strategy as well as the quantity that you wish to trade. Let’s explore this concept with an example:
Your technical signal might be a simple indicator like slow stochastic (included in your Tradesignal package). You would like to test if it is useful to go long if the indicator crosses above 50, and go short when the indicator crosses below 50.
This can be done by just dragging the Tradesignal pre-defined Stochastic Slow-Entry strategy onto the chart.
The influence of scales
The use of Scales plays a significant role when backtesting. When running a backtest like this over a longer period of time you may find that the absolute level of the market changes vastly. As an example, a contract that was traded for 100€ a few years ago may now have significantly increased and can now be traded for 1000€.
Of course, as the price of the asset has changed over such a wide span, it should be expected that the influence of your signals will have also been impacted. Trading one contract when the market runs from 20 to 22 is a different trade than when the market trades from 200 to 222. Let’s consider that market volatility has not changed, the second trade will still have a higher impact on your equity curve than the first trade. With this example, the statistics of the backtest will neglect the P/L during a phase with low asset prices.
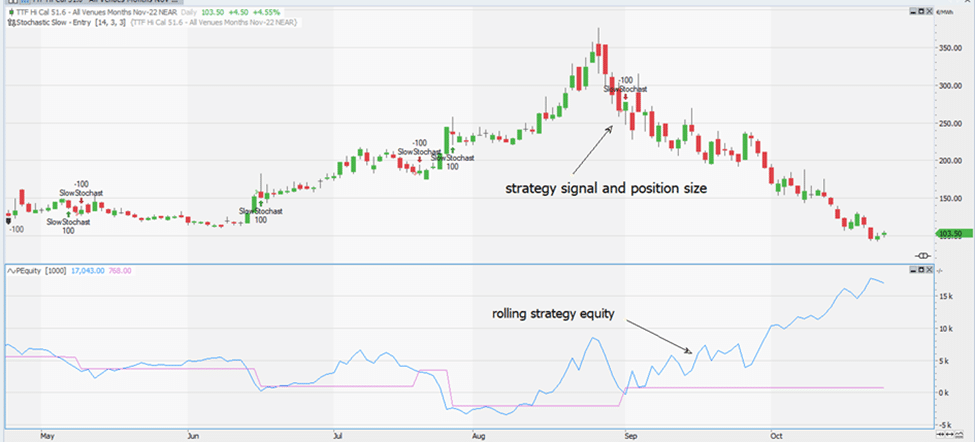
The above chart provides an example of such a behaviour. The bar chart is TTF gas, the blue line represents the rolling returns of the slow stochastics trading strategy. It can be observed that the higher price of TTF and the higher volatility of this asset lead to some unexpected equity swings. This could be avoided with a strategy which adjusts its position size to scale and volatility.
Overcoming scale dependency
One way to overcome or counter this effect in your backtesting is to introduce a form of position sizing. This can be done either using the absolute market level or, even better, the overall market volatility.
Consider weighting your position in a way that either the absolute scale level or the volatility of the market is cut out of the equation.
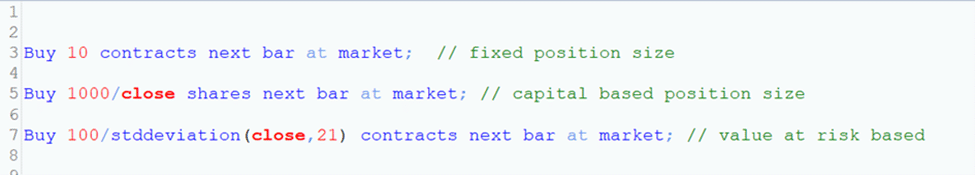
The easiest approach would be to say that the strategy should buy/sell as many shares as it can buy for a fixed sum of capital. This would eliminate the influence of the absolute scale level on the backtest results.
An alternative route would be to instruct the strategy to buy as many contracts as it can afford with a fixed risk capital and a measure for this risk (e.g. standard deviation).
The pre-defined Tradesignal strategies can be used to buy and sell the default quantity given in the money management settings, and can therefore be enhanced with a single line of programming to facilitate a sizing algorithm.
Program your position sizing algorithm
Tradesignal position sizing can be carried out either directly in the code of the strategy, or in a separate strategy dragged onto the chart.
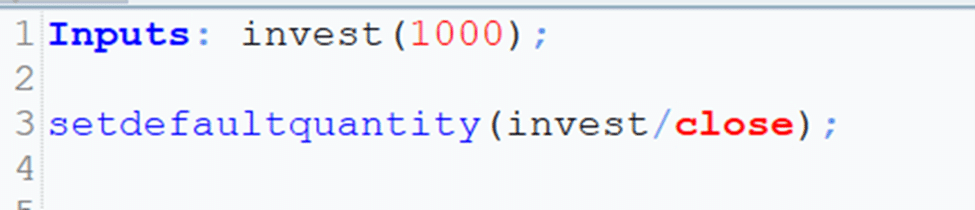
Below you will find an example of how one would hard code the number of contracts that are required to trade:
Conversely, the below example shows how to use a separate strategy to do the position sizing. Using this method, it is easy to implement a drag-on position sizing algorithm for the pre-defined trading strategies, without changing the code. If the strategy code just says buy and does not give the quantity to trade, the following code will take over and set the quantity.
The Key To Success
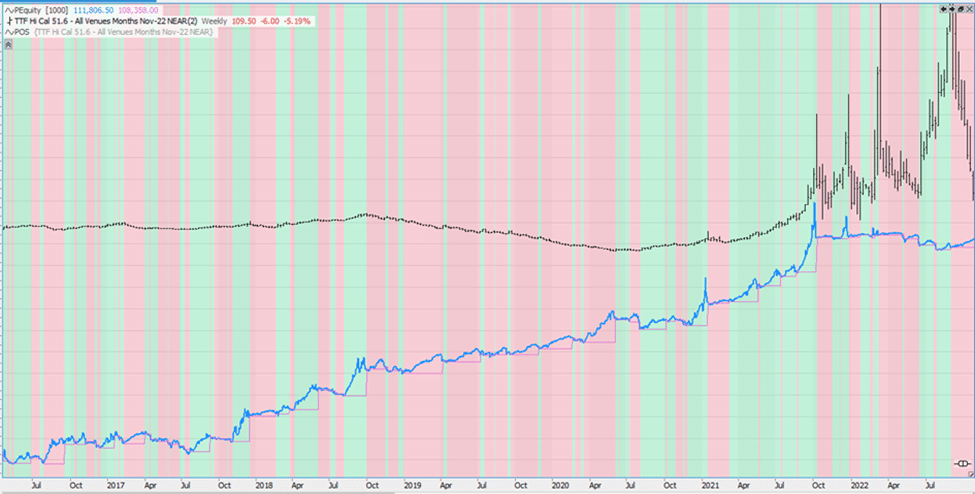
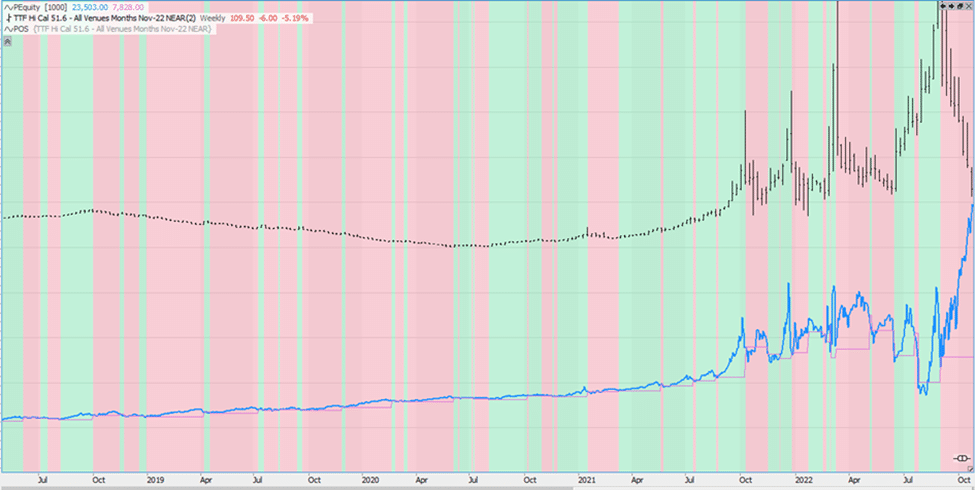
The above image shows the adjusted position size of the slow stochastic strategy by using the volatility-based approach shown above. As you can see, the unexpected behaviour of the strategy is gone.
We compare this approach with the fixed-volume approach, it clearly shows the advantages of a backtest done when combined with intelligent position sizing. It’s my belief that avoiding unexpected behaviour is the key to success with algorithmic trading. Take care and good luck!